Well, this should be an enlightening mid-month technical analysis of gold and silver prices. It has certainly been an interesting month of price action in gold and silver. While some might complain that the market has been rather unkind to silver stackers, one can’t complain that the precious metals price action has been boring.
Since, last month, I unashamedly crowed about how spot on my analysis the previous month had proven to be, it’s only proper that I now humbly apologize for how woefully off the mark I was in my writeup last month – July. Actually, I didn’t miss it by much on gold, but my silver forecast turned out to be excessively naively optimistic. I was off on my pegging of silver’s likely support level by a good three dollars-plus. I had pegged support around the $30 price level. Well, the bottom of the pullback turned out to be $26.50. No excuses – I just totally missed the mark. I really did not see silver falling back down into the $26-$27 range, and that was – obviously – a lack of vision on my part.
Hopefully, I learned my lesson – that one should never underestimate the ferocity with which the eight main bullion banks will attempt to suppress the price of silver as much as they can. (And I think we might have pissed them off with the way silver blew up through the $30 resistance level with relative ease, and appeared to be heading straight for the next notch on its belt, the $35 level.) Well, anyway, in short, my sincere apologies – sorry, kids, I never wish to get things wrong. I shall certainly endeavor to sharpen both my eyesight and my insight, going forward (which is, of course, the only direction that we can go – we’re not allowed to back up and rework the past).
(The UsualNote: I’m writing this analysis at, approximately, Thursday morning, August 15th – give or take a few hours - just to provide you with a point of reference. Obviously, any significant price changes that have occurred since that time should be taken into consideration as you conduct your own market analysis. The UsualDisclaimer: My stunningly misguided silver forecast last month can at least, hopefully, serve to reinforce the importance of doing your own research and market analysis. Because, as I always take care to point out here, I do not possess an infallible crystal ball. The only things I have to work with are a pen (well, okay, technically, a keyboard) and about half a brain.
All right then, let’s take a look at the current market price action in gold and silver, as reflected on the daily, weekly, and monthly futures price charts.
(Just out of curiosity, how did you handle the hailstorm? Did you hang on (yes, I did), or did those bears, fiercely growling and gnashing their teeth, scare you out of the market? Well, if they did – and that would be perfectly understandable under the circumstances – you’ve certainly had plenty of time to re-enter the market, as the recovery, at least for silver, was anything but instantaneous. Gold buyers suffered significantly less stress, as gold didn’t drop as severely as silver did, and gold prices recovered pretty quickly.)
Technical Analysis of Gold – Most Recent Price Action
All right, to begin with, let’s take a look at the daily chart of nearby gold futures and review –
The price action over the past month
How the daily chart for gold appears relative to key technical indicators, namely, the 20-day and 50-day exponential moving averages
(Yet another customary note: My technical analysis is done using the nearby COMEX futures charts. There is, of course, normally a slight difference between spot prices and the most nearby futures prices. This morning, the gold futures price – sitting around $2,477 – is approximately $30 higher than the spot gold price, which is at $2,447. Silver futures are around $28.10, virtually identical to the price of spot silver.)
The price action in gold over the past month, depicted on the chart below, starts at about the middle of the chart, where the MACD peaks as gold made a new high at $2,488. Since that time, gold has moved as follows:
Sharply lower, pulling back to as low as $2,353, the low of the past month’s price action (you may note that price level pretty much coincides with previous support levels going back to April)
Sharply higher, rising to a new intraday all-time high of $2,522
Sharply lower again, with the market this time catching support pretty much dead on the money right at the 20-day exponential moving average (EMA – blue line on the chart), around $2,420
Sharply higher once more, with gold scoring a new all-time high closing price of $2,510, although not making a new all-time high intraday price
Since then, the market has pulled back only modestly, to around the $2,480 level
Now let’s pull back for a longer-term view of gold’s price action, extending all the way back to near the first of the year. You can see that, while it’s been slightly violated for brief periods of time, the 20-day EMA has served pretty well as far as tracking price support for gold.
Now, let’s change things up a bit – changing our moving average from the 20-day EMA to the 50-day EMA. It’s quite clear, from the chart below, that the 50-day EMA has been an even more accurate technical indicator of price support for the market. It has only very briefly been ever so slightly violated, on little more than a handful of days over the past several months. And on the lowest down move within the past month, the price of gold only dipped about $15 below the 50-day EMA, while it had plunged to more than $50 below the 20-day EMA. Plus, the closing price of gold was only below the 50-day EMA for one day, while it was below the 20-day moving average for three consecutive days.
The 50-day EMA is currently at about $2,410. 30 days ago, it was at $2,353, which rather remarkably exactly presaged the low of the pullback.
From all of this, I think we can definitely peg the 50-day EMA as a continuing key price support level for gold.
The MACD on the daily chart appears bullish, per both the MACD signal line and the MACD histogram. Both momentum indicators have been positive, except for just a few days during the sharpest sell-off that occurred within the past 30 days of price action in the gold market.
Long-term Technical Analysis of Gold
Let’s have a look at the longer-term picture of gold price action, as reflected on the weekly chart. The price action shown on the chart below extends back to late 2022. On this chart, I’ve switched the EMA back to a 20-period EMA. You can see that this has pretty well tracked gold’s price action on a weekly basis, and served as a line of support, over roughly the past two years.
In fact, the 20-week moving average hasn’t even been seriously threatened since back around the first of the year. It currently sits around the low of the past month, at around the $2,360 level.
The MACD on the weekly chart, although it has fallen from its highest levels – which coincided with new highs scored back in April – has remained mostly bullish. Both the MACD histogram and signal line just flipped back to positive this week. That appears, to me, anyway, to indicate that gold prices may continue to gain momentum in the coming weeks.
Gold – Monthly Chart
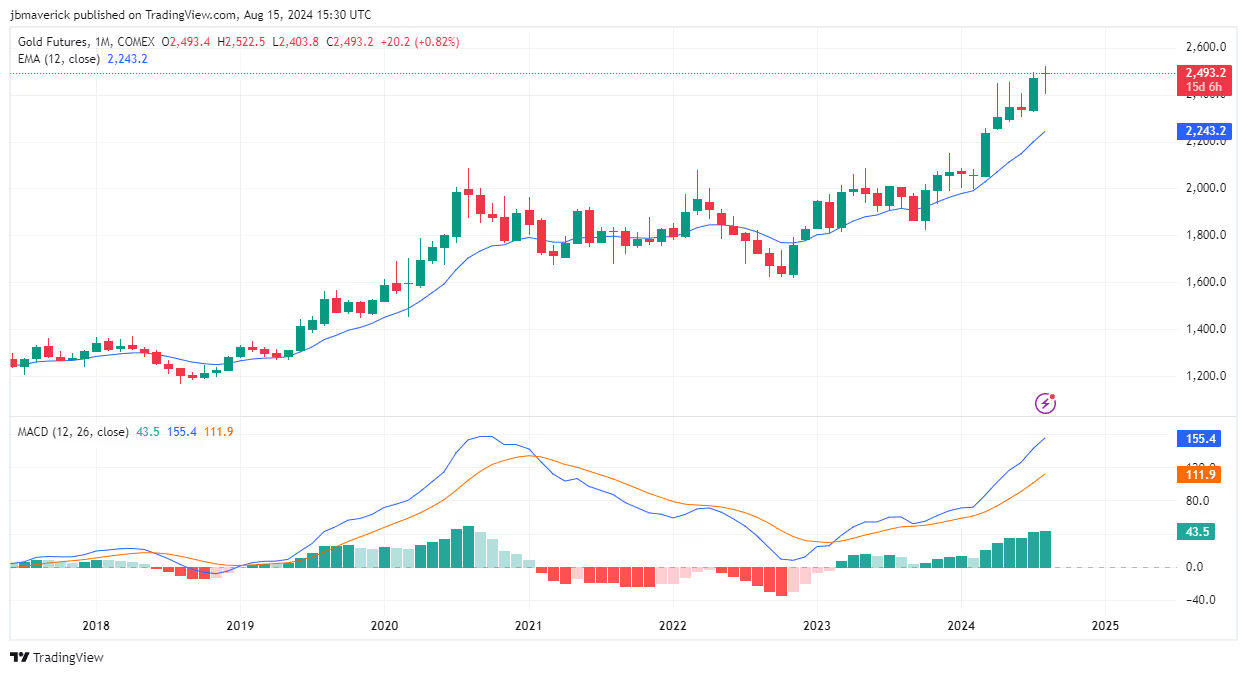
Polishing off our look at gold, let’s take a look at the monthly chart. Since there are 12 months in a year, I’ll change the EMA to a 12-period EMA (still the blue line). This chart shows price action extending back approximately seven years, to mid-2017.
Gold’s price action, as reflected on the monthly chart, shows prices ranging back and forth across the 12-month EMA (currently sitting around $2,250) from mid-2020 all the way through to early 2024. From there, gold has taken a sharp turn to the upside, moving all the way from around the $2,000 level up to around the $2,500 level. Note that, since October of 2023, there are several large bullish candlesticks showing gold’s monthly price action, while the very few down months have ended with only a very slight dip in the gold price.
The MACD signal line and histogram have both remained solidly bullish since early 2023. The only cautionary note here is that they are both near the highest levels that they’ve previously reached over the entire time frame shown on this chart. That doesn’t necessarily mean that they can’t continue higher – only that it shouldn’t come as a shock if they should take a turn to the downside. However, should that occur, I’d note that a previous extended drop in the MACD levels, from 2021 to 2023, did not portend a major decline in the price of gold. Rather, after an initial moderate pullback, gold prices mostly just consolidated and traded in a range over that time period while the MACD kept falling.
Technical Analysis of Silver – Most Recent Price Action
All right, time to take a look at poor, battered silver. As already noted, I totally missed the mark when, in last month’s analysis, I pegged support for silver right around the $30 level. The low of this past month turned out, instead, to be all the way down at $26.50. Ouch. This has happened despite every fundamental analyst that I’ve read absolutely screaming that, based on basic supply and demand, silver prices should be much, much higher. That fact makes the recent price action smack of market manipulation, but manipulation or not, the price is what it is.
Over almost the whole of the past month, silver has traded consistently below its 20-day EMA, as shown on the chart below. There are, however, a couple of encouraging notes for silver bulls.
The low price level of $26.50 coincides almost exactly with the previous price level where silver found support back in early May
The price of silver is notching back above the 20-day EMA on a strong move upward, as I’m typing this – currently trading around $28.45, with an intraday high a bit over $28.50
One additional potentially bullish note comes courtesy of the MACD on the daily chart. Provided that today’s current price action holds up at the end of the day, both the MACD histogram and the MACD signal will have turned bullish for the first time in the past month.
Changing to using the 50-day EMA also shows a decidedly dismal view over the past month for silver bulls, as price action has yet to claw its way back above the 50-day moving average. However, again, the most recent price action – namely, today’s – does show silver, at least so far, making a strong move to the upside and getting close to the 50-day EMA, which sits at $28.80. (The 20-day EMA is about 50 cents lower, around $28.30.)
Long-term Technical Analysis of Silver
Things look somewhat more encouraging for silver bulls when we take a look at the weekly futures chart, using a 50-week EMA. You can see that the 50-period EMA has served relatively well for tracking a support line for silver. Even the most recent, rather severe, sell-off only managed to just touch the 50-period moving average on an intraday basis.
That 50-week moving average is currently around the low of the recent pullback, at about $26.60. A month ago, it was at approximately $26.35. Thus, it is still moving higher, despite the past month’s sharp drawdown in silver prices.
A glance at the weekly chart’s MACD shows that it definitely took a nosedive over the past month. However, the MACD histogram – while still solidly bearish, right along with the MACD signal line – appears to be flattening out. It’s also at about the lowest level below the zero line that it’s been since early 2023, so it may now be ripe for a turn back to the upside.
(Note: While my price support forecast for silver last month remains way off, I did note in last month’s technical analysis that the MACD signal line on the weekly chart looked like momentum might be prone to a rollover to the downside.)
Silver – Monthly Chart
Let’s wind things up with a look at the monthly silver futures chart, using a 12-period exponential moving average. The monthly chart also shows a much less gloomy picture of silver’s price action. The downtrend of the past three months has barely touched the 12-month EMA, thus, indicating an overall, long-term uptrend still in place. Also, note that this three-month swing to the downside represents just about a 50% retracement of the sharp uptrend that occurred over the three months prior to that downside retracement.
The 12-period moving average on the monthly chart is currently at about $26.65. That’s almost exactly the same as the $26.60 level of the 50-period EMA on the weekly chart, which reinforces the level just above $26.50 as a support level.
The MACD on the monthly chart appears to still be overall bullish, according to both the MACD signal line and the MACD histogram. In fact, while the histogram has flattened out (although still well above the zero line), the MACD signal line actually indicates increasing upward momentum even over the past three months when silver prices have pulled back.
Technical Analysis of Gold and Silver Prices – August, 2024 – Conclusion
Let me begin by once again repeating a seasonal note, that precious metals prices, historically, tend to bottom out in June and then trend higher into September, before dipping slightly and then finishing the year strongly.
So, where do we sit, based on the past month’s precious metals price action? First, despite the precious metals complex taking a hard slap in the face right after gold had hit a new all-time high, the overall, long-term uptrend for gold and silver remains in place.
To be more specific and more focused on the near term, gold looks undeniably bullish, while silver has only managed to claw its way back up to looking like it might once again turn bullish.
I had pegged gold support around $2,400 last month. While it did get briefly slammed down to around $2,350, for the bulk of the month gold futures pretty well managed to hold that $2,400 level, and are currently once again challenging the $2,500 level. As noted in last month’s analysis, being in the uncharted waters of new all-time highs puts the ceiling on gold prices at “God only knows” levels. $3,000? $5,000? $10,000? Well, like I just said, God only knows. We mortals will have to wait and see.
As far as support, for the moment I’m going to peg gold support a bit above the $2,400 level. That’s based on the 50-day EMA being at around $2,410, combined with the strong move back up to around the $2,500 level.
Gold Nearby support level - $2,420-$2,450 Next resistance levels after $2,500 (which may have already been cleared by the time you read this) - $2,600, $2,750, $2,800-$3,000 (I put $2,750 in there because it’s the halfway point between $2,500 and $3,000)
With silver, I want to repeat a note from last month’s analysis. I still believe that if gold continues making new highs, at some point there will be a sort of slingshot action in silver that starts jumping silver higher at a significantly larger percentage price increase pace than gold is experiencing. I expect the gold/silver ratio to decline substantially over the long term.
Okay, so it’s been an ugly month for silver bulls, definitely disappointing after silver had made such a seemingly strong push above the $30 resistance level, which it will now have to overcome again if prices are to move decisively higher. However, the overall picture for silver – especially looking at the longer-term charts – doesn’t appear all that bleak. A long-term uptrend still looks to be, at the moment anyway, solidly in place.
If it’s going to move up, silver will have to take out resistance dollar by dollar, at $29, $30, $31, and $32 before it can look to, once again, aim for the landmarks of $35, $40, $45, $50, and higher.
Even having missed by more than $3 on my peg of silver support last month won’t stop me from being rather bold with my peg of support for silver prices this month. Barring a major market trend reversal for the precious metals, I’m going to tag that recent low around $26.60 as the probable absolute bottom for silver at this point. I’m basing that bold forecast on several factors –
That’s the low of this recent sharp pullback, which, as noted, represents about a 50% retracement from the move up that occurred from March through May
That $26.60 price support level matches both the 50-period moving average support line showing on the weekly chart and the 12-period moving average line on the monthly chart
That price level also coincides with the lows reached on the pullback that occurred near the first of the year
Gold continues to push higher, which, logically, should also see the price of silver moving higher
The current supply and demand picture for silver argues strongly against lower prices
I’m not saying that it’s impossible for silver to dip a bit lower – say, down to around $25.50 – but I am saying that I consider it very unlikely, based on the current market picture. Plus, I think that, with the past month’s slam, the bears have likely scared out all the bulls that are capable of being scared out of the market. I seriously doubt that they’ll be able to pull off a repeat performance of that smackdown of silver prices.
Silver Nearby support levels - $28.00, $27.20, $26.60 Next resistance levels - $29.00, $30.00, $31.00-$32.00, $35.00
So, as of Thursday, August 15, 2024, that’s how the gold and silver market looks to me. The most likely near-term scenario remains looking for higher prices for both gold and silver.
In closing, I want to, as always, thank our friends at TradingView.com for their excellent charting services


.avif)


.jpg)
.jpg)
